> ## Documentation Index
> Fetch the complete documentation index at: https://docs.tilebox.com/llms.txt
> Use this file to discover all available pages before exploring further.
# Xarray
> Tilebox uses Xarray as its primary data structure for representing and analyzing multi-dimensional satellite data with labeled dimensions and coordinates.
[example_satellite_data.nc]: https://github.com/tilebox/docs/raw/main/assets/data/example_satellite_data.nc
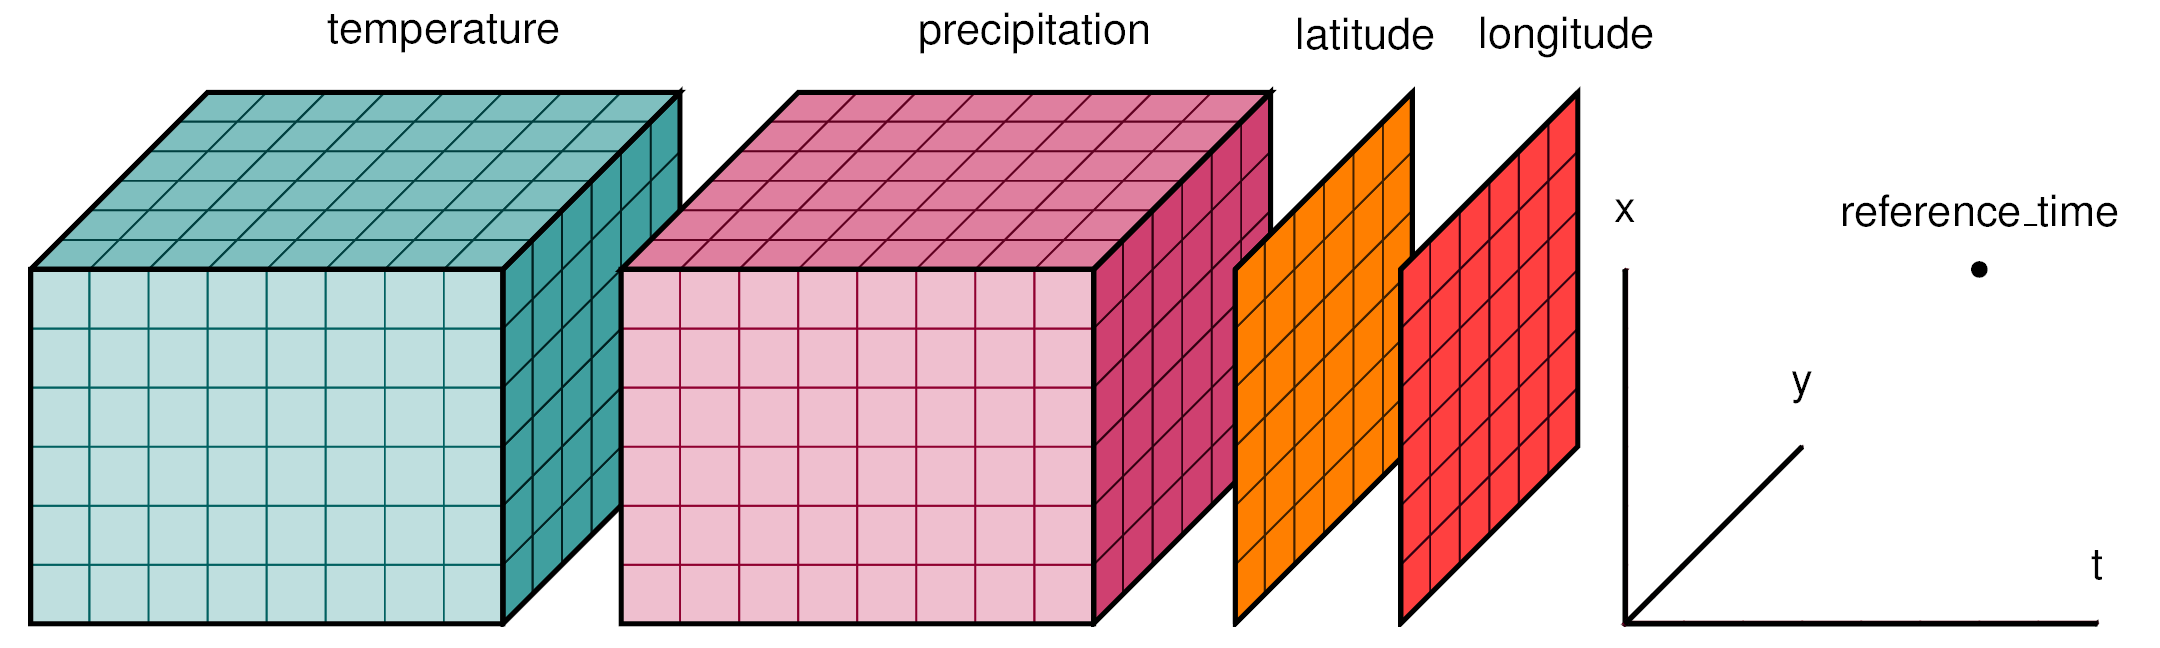
[Xarray](https://xarray.dev/) is a library designed for working with labeled multi-dimensional arrays. Built on top of [NumPy](https://numpy.org/) and [Pandas](https://pandas.pydata.org/), Xarray adds labels in the form of dimensions, coordinates, and attributes, enhancing the usability of raw NumPy-like arrays. This enables a more intuitive, concise, and less error-prone development experience. The library also includes a large and expanding collection of functions for advanced analytics and visualization.
 An overview of the Xarray library and its suitability for N-dimensional data (such as Tilebox time series datasets) is available in the official [Why Xarray? documentation page](https://xarray.pydata.org/en/stable/why-xarray.html).
The Tilebox Python client provides access to satellite data as an [xarray.Dataset](https://docs.xarray.dev/en/stable/generated/xarray.Dataset.html#xarray.Dataset). This approach offers a great number of benefits over custom Tilebox-specific data structures:
Xarray is based on NumPy and Pandas—two of the most widely used Python libraries for scientific computing. Familiarity with these libraries translates well to using Xarray.
Leveraging NumPy, which is built on C and Fortran, Xarray benefits from extensive performance optimizations. This allows Xarray to efficiently handle large datasets.
As a widely used library, Xarray easily integrates with many other libraries. Many third-party libraries are also available to expand Xarray's capabilities for diverse use cases.
Xarray is versatile and supports a broad range of applications. It's also easy to extend with custom features.
## Example dataset
To understand how Xarray functions, below is a quick a look at a sample dataset as it might be retrieved from a [Tilebox datasets](/datasets/concepts/datasets) client.
```python Python theme={"system"}
from tilebox.datasets import Client
client = Client()
datasets = client.datasets()
collection = datasets.open_data.copernicus.landsat8_oli_tirs.collection("L1GT")
satellite_data = collection.query(temporal_extent=("2022-05-01", "2022-06-01"), show_progress=True)
print(satellite_data)
```
```plaintext Output theme={"system"}
Size: 305kB
Dimensions: (time: 514, latlon: 2)
Coordinates:
ingestion_time (time) datetime64[ns] 4kB 2024-07-22T09:06:43.5586...
id (time)
This basic dataset illustrates common use cases for Xarray. To follow along, you can [download the dataset as a NetCDF file][example_satellite_data.nc]. The [Reading and writing files section](/sdks/python/xarray#reading-and-writing-files) explains how to save and load Xarray datasets from NetCDF files.
Here's an overview of the output:
* The `satellite_data` **dataset** contains **dimensions**, **coordinates**, and **variables**.
* The `time` **dimension** has 514 elements, indicating that there are 514 data points in the dataset.
* The `time` **dimension coordinate** contains datetime values representing when the data was measured. The `*` indicates a dimension coordinate, which enables label-based indexing and alignment.
* The `ingestion_time` **non-dimension coordinate** holds datetime values for when the data was ingested into Tilebox. Non-dimension coordinates carry coordinate data but are not used for label-based indexing. They can even be [multidimensional](https://docs.xarray.dev/en/stable/examples/multidimensional-coords.html).
* The dataset includes 28 **variables**.
* The `bands` **variable** contains integers indicating how many bands the data contains.
* The `sun_elevation` **variable** contains floating-point values representing the sun's elevation when the data was measured.
Explore the [xarray terminology overview](https://docs.xarray.dev/en/stable/user-guide/terminology.html) to broaden your understanding of **datasets**, **dimensions**, **coordinates**, and **variables**.
## Accessing data in a dataset
### By index
You can access data in different ways. The Xarray documentation offers a [comprehensive overview](https://docs.xarray.dev/en/stable/user-guide/indexing.html) of these methods.
To access the `sun_elevation` variable:
```python Accessing values theme={"system"}
# Print the first sun elevation value
print(satellite_data.sun_elevation[0])
```
```plaintext Output theme={"system"}
Size: 8B
array(44.19904463)
Coordinates:
ingestion_time datetime64[ns] 8B 2024-07-22T09:06:43.558629
id Size: 665B
Dimensions: (latlon: 2)
Coordinates:
ingestion_time datetime64[ns] 8B 2024-07-22T09:06:43.558629
id Size: 2kB
Dimensions: (time: 3, latlon: 2)
Coordinates:
ingestion_time (time) datetime64[ns] 24B 2024-07-22T09:08:24.7395...
id (time) Size: 216B
array([63.89629314, 63.35038654, ..., 64.37400345, 64.37400345])
Coordinates:
ingestion_time (time) datetime64[ns] 216B 2024-07-22T09:06:43.558629 ......
id (time) 45) &
(satellite_data.sun_elevation < 90)
)
filtered_sun_elevations = satellite_data.sun_elevation[data_filter]
print(filtered_sun_elevations)
```
```plaintext Output theme={"system"}
Size: 216B
array([63.89629314, 63.35038654, ..., 64.37400345, 64.37400345])
Coordinates:
ingestion_time (time) datetime64[ns] 216B 2024-07-22T09:06:43.558629 ......
id (time)
Selecting data by value requires unique coordinate values. In case of duplicates, you will encounter an `InvalidIndexError`. To avoid this, you can [drop duplicates](#dropping-duplicates).
```python Indexing by time theme={"system"}
specific_datapoint = satellite_data.sel(time="2022-05-01T11:28:28.249000")
print(specific_datapoint)
```
```plaintext Output theme={"system"}
Size: 665B
Dimensions: (latlon: 2)
Coordinates:
ingestion_time datetime64[ns] 8B 2024-07-22T09:06:43.558629
id >> raises KeyError: "2022-05-01T11:28:28.000000"
```
To return the closest value instead of raising an error, specify a `method`.
```python Finding the closest data point theme={"system"}
nearest_datapoint = satellite_data.sel(time="2022-05-01T11:28:28.000000", method="nearest")
assert nearest_datapoint.equals(specific_datapoint) # passes
```
## Dropping duplicates
Xarray allows you to drop duplicate values from a dataset. For example, to drop duplicate timestamps:
```python Dropping duplicates theme={"system"}
deduped = satellite_data.drop_duplicates("time")
```
De-duped datasets are required for certain operations, like [selecting data by value](#selecting-data-by-value).
## Statistics
Xarray and NumPy include a wide range of statistical functions that you can apply to a dataset or DataArray. Here are some examples:
```python Computing dataset statistics theme={"system"}
cloud_cover = satellite_data.cloud_cover
min_meas = cloud_cover.min().item()
max_meas = cloud_cover.max().item()
mean_meas = cloud_cover.mean().item()
std_meas = cloud_cover.std().item()
print(f"Cloud cover ranges from {min_meas:.2f} to {max_meas:.2f} with a mean of {mean_meas:.2f} and a standard deviation of {std_meas:.2f}")
```
```plaintext Output theme={"system"}
Cloud cover ranges from 0.00 to 100.00 with a mean of 76.48 and a standard deviation of 34.17
```
You can also directly apply many NumPy functions to datasets or DataArrays. For example, to find out how many unique bands the data contains, use [np.unique](https://numpy.org/doc/stable/reference/generated/numpy.unique.html):
```python Finding unique values theme={"system"}
import numpy as np
print("Sensors:", np.unique(satellite_data.bands))
```
```plaintext Output theme={"system"}
Sensors: [12]
```
## Reading and writing files
Xarray provides a simple method for saving and loading datasets from files. This is useful for sharing your data or storing it for future use. Xarray supports many different file formats, including NetCDF, Zarr, GRIB, and more. For a complete list of supported formats, refer to the [official documentation page](https://docs.xarray.dev/en/stable/user-guide/io.html).
To save the example dataset as a NetCDF file:
You may need to install the `netcdf4` package first.
```python Saving a dataset to a file theme={"system"}
satellite_data.to_netcdf("example_satellite_data.nc")
```
This creates a file named `example_satellite_data.nc` in your current directory. You can then load this file back into memory with:
```python Loading a dataset from a file theme={"system"}
import xarray as xr
satellite_data = xr.open_dataset("example_satellite_data.nc")
```
If you would like to follow along with the examples in this section, you can download the example dataset as a NetCDF file [here][example_satellite_data.nc].
## Further reading
This section covers only a few common use cases for Xarray. The library offers many more functions and features. For more information, please see the [Xarray documentation](https://xarray.pydata.org/en/stable/) or explore the [Xarray Tutorials](https://tutorial.xarray.dev/intro.html).
Some useful capabilities not covered in this section include:
An overview of the Xarray library and its suitability for N-dimensional data (such as Tilebox time series datasets) is available in the official [Why Xarray? documentation page](https://xarray.pydata.org/en/stable/why-xarray.html).
The Tilebox Python client provides access to satellite data as an [xarray.Dataset](https://docs.xarray.dev/en/stable/generated/xarray.Dataset.html#xarray.Dataset). This approach offers a great number of benefits over custom Tilebox-specific data structures:
Xarray is based on NumPy and Pandas—two of the most widely used Python libraries for scientific computing. Familiarity with these libraries translates well to using Xarray.
Leveraging NumPy, which is built on C and Fortran, Xarray benefits from extensive performance optimizations. This allows Xarray to efficiently handle large datasets.
As a widely used library, Xarray easily integrates with many other libraries. Many third-party libraries are also available to expand Xarray's capabilities for diverse use cases.
Xarray is versatile and supports a broad range of applications. It's also easy to extend with custom features.
## Example dataset
To understand how Xarray functions, below is a quick a look at a sample dataset as it might be retrieved from a [Tilebox datasets](/datasets/concepts/datasets) client.
```python Python theme={"system"}
from tilebox.datasets import Client
client = Client()
datasets = client.datasets()
collection = datasets.open_data.copernicus.landsat8_oli_tirs.collection("L1GT")
satellite_data = collection.query(temporal_extent=("2022-05-01", "2022-06-01"), show_progress=True)
print(satellite_data)
```
```plaintext Output theme={"system"}
Size: 305kB
Dimensions: (time: 514, latlon: 2)
Coordinates:
ingestion_time (time) datetime64[ns] 4kB 2024-07-22T09:06:43.5586...
id (time)
This basic dataset illustrates common use cases for Xarray. To follow along, you can [download the dataset as a NetCDF file][example_satellite_data.nc]. The [Reading and writing files section](/sdks/python/xarray#reading-and-writing-files) explains how to save and load Xarray datasets from NetCDF files.
Here's an overview of the output:
* The `satellite_data` **dataset** contains **dimensions**, **coordinates**, and **variables**.
* The `time` **dimension** has 514 elements, indicating that there are 514 data points in the dataset.
* The `time` **dimension coordinate** contains datetime values representing when the data was measured. The `*` indicates a dimension coordinate, which enables label-based indexing and alignment.
* The `ingestion_time` **non-dimension coordinate** holds datetime values for when the data was ingested into Tilebox. Non-dimension coordinates carry coordinate data but are not used for label-based indexing. They can even be [multidimensional](https://docs.xarray.dev/en/stable/examples/multidimensional-coords.html).
* The dataset includes 28 **variables**.
* The `bands` **variable** contains integers indicating how many bands the data contains.
* The `sun_elevation` **variable** contains floating-point values representing the sun's elevation when the data was measured.
Explore the [xarray terminology overview](https://docs.xarray.dev/en/stable/user-guide/terminology.html) to broaden your understanding of **datasets**, **dimensions**, **coordinates**, and **variables**.
## Accessing data in a dataset
### By index
You can access data in different ways. The Xarray documentation offers a [comprehensive overview](https://docs.xarray.dev/en/stable/user-guide/indexing.html) of these methods.
To access the `sun_elevation` variable:
```python Accessing values theme={"system"}
# Print the first sun elevation value
print(satellite_data.sun_elevation[0])
```
```plaintext Output theme={"system"}
Size: 8B
array(44.19904463)
Coordinates:
ingestion_time datetime64[ns] 8B 2024-07-22T09:06:43.558629
id Size: 665B
Dimensions: (latlon: 2)
Coordinates:
ingestion_time datetime64[ns] 8B 2024-07-22T09:06:43.558629
id Size: 2kB
Dimensions: (time: 3, latlon: 2)
Coordinates:
ingestion_time (time) datetime64[ns] 24B 2024-07-22T09:08:24.7395...
id (time) Size: 216B
array([63.89629314, 63.35038654, ..., 64.37400345, 64.37400345])
Coordinates:
ingestion_time (time) datetime64[ns] 216B 2024-07-22T09:06:43.558629 ......
id (time) 45) &
(satellite_data.sun_elevation < 90)
)
filtered_sun_elevations = satellite_data.sun_elevation[data_filter]
print(filtered_sun_elevations)
```
```plaintext Output theme={"system"}
Size: 216B
array([63.89629314, 63.35038654, ..., 64.37400345, 64.37400345])
Coordinates:
ingestion_time (time) datetime64[ns] 216B 2024-07-22T09:06:43.558629 ......
id (time)
Selecting data by value requires unique coordinate values. In case of duplicates, you will encounter an `InvalidIndexError`. To avoid this, you can [drop duplicates](#dropping-duplicates).
```python Indexing by time theme={"system"}
specific_datapoint = satellite_data.sel(time="2022-05-01T11:28:28.249000")
print(specific_datapoint)
```
```plaintext Output theme={"system"}
Size: 665B
Dimensions: (latlon: 2)
Coordinates:
ingestion_time datetime64[ns] 8B 2024-07-22T09:06:43.558629
id >> raises KeyError: "2022-05-01T11:28:28.000000"
```
To return the closest value instead of raising an error, specify a `method`.
```python Finding the closest data point theme={"system"}
nearest_datapoint = satellite_data.sel(time="2022-05-01T11:28:28.000000", method="nearest")
assert nearest_datapoint.equals(specific_datapoint) # passes
```
## Dropping duplicates
Xarray allows you to drop duplicate values from a dataset. For example, to drop duplicate timestamps:
```python Dropping duplicates theme={"system"}
deduped = satellite_data.drop_duplicates("time")
```
De-duped datasets are required for certain operations, like [selecting data by value](#selecting-data-by-value).
## Statistics
Xarray and NumPy include a wide range of statistical functions that you can apply to a dataset or DataArray. Here are some examples:
```python Computing dataset statistics theme={"system"}
cloud_cover = satellite_data.cloud_cover
min_meas = cloud_cover.min().item()
max_meas = cloud_cover.max().item()
mean_meas = cloud_cover.mean().item()
std_meas = cloud_cover.std().item()
print(f"Cloud cover ranges from {min_meas:.2f} to {max_meas:.2f} with a mean of {mean_meas:.2f} and a standard deviation of {std_meas:.2f}")
```
```plaintext Output theme={"system"}
Cloud cover ranges from 0.00 to 100.00 with a mean of 76.48 and a standard deviation of 34.17
```
You can also directly apply many NumPy functions to datasets or DataArrays. For example, to find out how many unique bands the data contains, use [np.unique](https://numpy.org/doc/stable/reference/generated/numpy.unique.html):
```python Finding unique values theme={"system"}
import numpy as np
print("Sensors:", np.unique(satellite_data.bands))
```
```plaintext Output theme={"system"}
Sensors: [12]
```
## Reading and writing files
Xarray provides a simple method for saving and loading datasets from files. This is useful for sharing your data or storing it for future use. Xarray supports many different file formats, including NetCDF, Zarr, GRIB, and more. For a complete list of supported formats, refer to the [official documentation page](https://docs.xarray.dev/en/stable/user-guide/io.html).
To save the example dataset as a NetCDF file:
You may need to install the `netcdf4` package first.
```python Saving a dataset to a file theme={"system"}
satellite_data.to_netcdf("example_satellite_data.nc")
```
This creates a file named `example_satellite_data.nc` in your current directory. You can then load this file back into memory with:
```python Loading a dataset from a file theme={"system"}
import xarray as xr
satellite_data = xr.open_dataset("example_satellite_data.nc")
```
If you would like to follow along with the examples in this section, you can download the example dataset as a NetCDF file [here][example_satellite_data.nc].
## Further reading
This section covers only a few common use cases for Xarray. The library offers many more functions and features. For more information, please see the [Xarray documentation](https://xarray.pydata.org/en/stable/) or explore the [Xarray Tutorials](https://tutorial.xarray.dev/intro.html).
Some useful capabilities not covered in this section include: