

open_data.aws_earth.sentinel1 dataset. In this guide, you query a scene over Venice, read its VV polarization measurement, and create a north-up monochrome radar image.
Prerequisites
- You have a Tilebox API key.
- You have Python 3.11 or newer.
Select a Sentinel-1 scene
Define an area around Venice, then query a dual-polarization Sentinel-1C scene from October 4, 2025:Python
Resolve the VV measurement
Each datapoint provides measurement COGs for its available polarizations, alongside product, calibration, noise, manifest, and preview assets. Select the VV measurement and resolve its public HTTPS location:Python
Read a north-up image window
Sentinel-1 GRD measurement COGs store geolocation as ground control points. Use aWarpedVRT to apply that geolocation, project the image, and read a bounded north-up window without downloading the complete scene:
Python
Render the radar image
Stretch the central 96% of valid pixel values across a gray display range, then save the result:Python
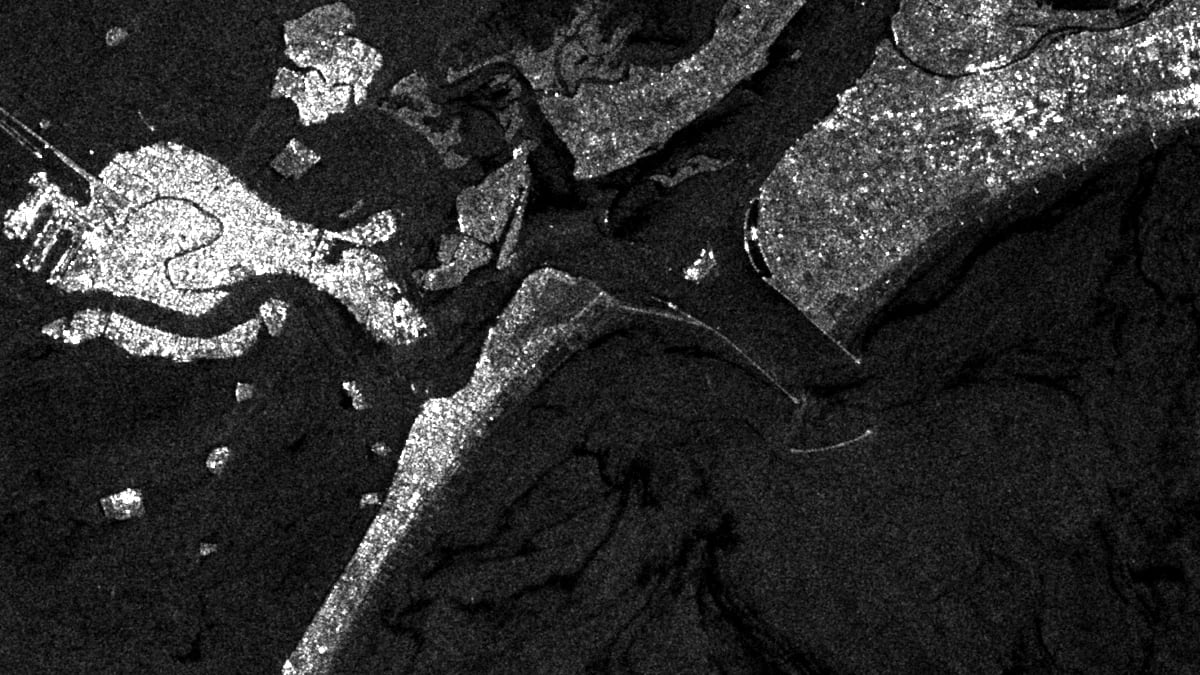
This percentile stretch creates a visual image from the stored measurement values. Calibrate the measurement and account for acquisition geometry before using pixel values in quantitative SAR analysis.
Next steps
Create a Sentinel-2 RGB image
Build a cloud-free optical RGB image from three spectral bands.
Assets and storage
Understand how dataset metadata connects queries to files in object storage.