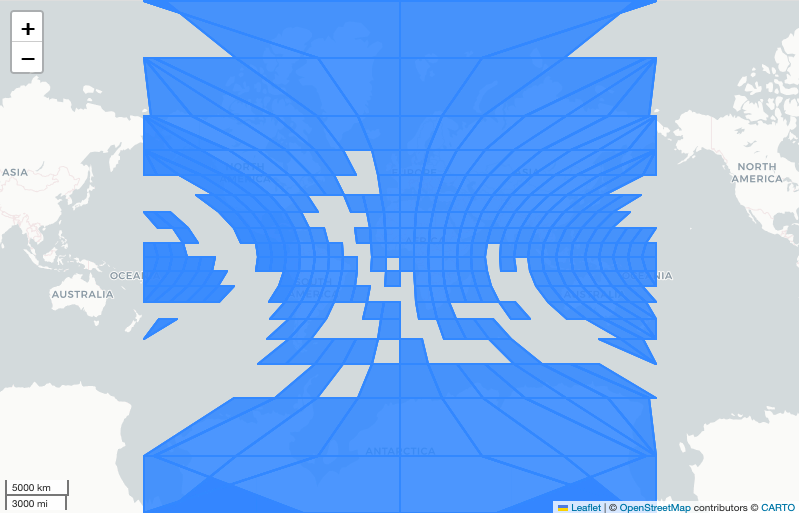
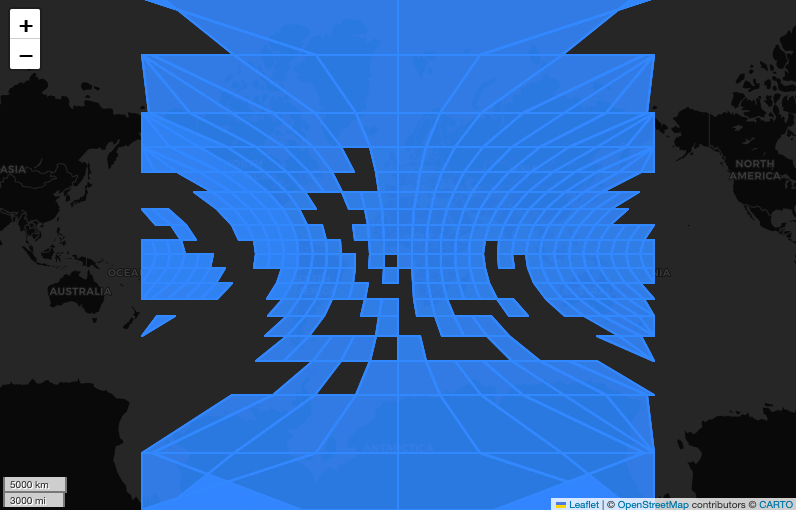
This page guides you through the process of ingesting data into a Tilebox dataset. Starting from an existing
dataset available as file in the GeoParquet format, you’ll go through the process of
ingesting that data into Tilebox as a Timeseries dataset.
Downloading the example dataset
The dataset used in this example is available as a GeoParquet file. You can download it
from here: modis_MCD12Q1.geoparquet.
Installing the necessary packages
This example uses a couple of python packages for reading parquet files and for visualizing the dataset. Install the
required packages using your preferred package manager. For new projects, Tilebox recommend using uv.
uv add tilebox-datasets geopandas lonboard
 
Reading and previewing the dataset
The dataset is available as a GeoParquet file. You can read it using the geopandas.read_parquet function.
import geopandas as gpd
modis_data = gpd.read_parquet("modis_MCD12Q1.geoparquet")
modis_data.head(5)
 
             time                  end_time                                   granule_name                                           geometry  horizontal_tile_number  vertical_tile_number   tile_id  file_size    checksum checksum_type day_night_flag browse_granule_id                     published_at
0 2001-01-01 00:00:00+00:00 2001-12-31 23:59:59+00:00  MCD12Q1.A2001001.h00v08.061.2022146024956.hdf  POLYGON ((-180 10, -180 0, -170 0, -172.62252 ...                       0                     8  51000008     275957   941243048         CKSUM            Day              None 2022-06-23 10:54:43.824000+00:00
1 2001-01-01 00:00:00+00:00 2001-12-31 23:59:59+00:00  MCD12Q1.A2001001.h00v09.061.2022146024922.hdf  POLYGON ((-180 0, -180 -10, -172.62252 -10, -1...                       0                     9  51000009     285389  3014510714         CKSUM            Day              None 2022-06-23 10:54:44.697000+00:00
2 2001-01-01 00:00:00+00:00 2001-12-31 23:59:59+00:00  MCD12Q1.A2001001.h00v10.061.2022146032851.hdf  POLYGON ((-180 -10, -180 -20, -180 -20, -172.6...                       0                    10  51000010     358728  2908215698         CKSUM            Day              None 2022-06-23 10:54:44.669000+00:00
3 2001-01-01 00:00:00+00:00 2001-12-31 23:59:59+00:00  MCD12Q1.A2001001.h01v08.061.2022146025203.hdf  POLYGON ((-172.62252 10, -170 0, -160 0, -162....                       1                     8  51001008     146979  1397661843         CKSUM            Day              None 2022-06-23 10:54:44.309000+00:00
4 2001-01-01 00:00:00+00:00 2001-12-31 23:59:59+00:00  MCD12Q1.A2001001.h01v09.061.2022146025902.hdf  POLYGON ((-170 0, -172.62252 -10, -162.46826 -...                       1                     9  51001009     148935  2314263965         CKSUM            Day              None 2022-06-23 10:54:44.023000+00:00
 
Exploring it visually
Geopandas comes with a built in explorer to visually explore the dataset.
from lonboard import viz
viz(modis_data, map_kwargs={"show_tooltip": True})
 
Create a Tilebox dataset
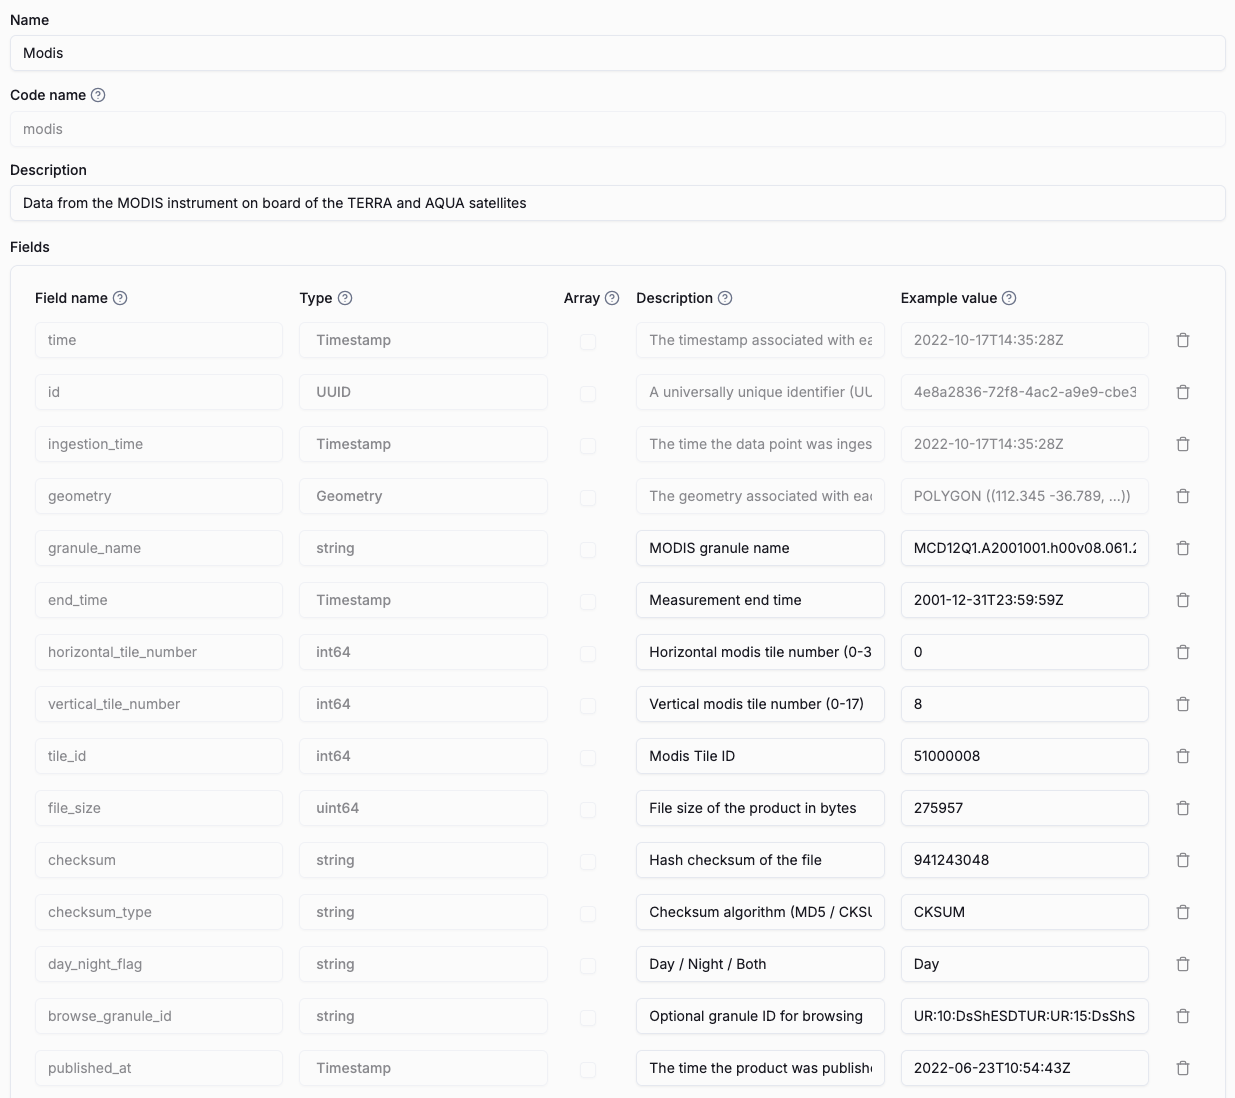
Now you’ll create a Spatio-temporal dataset with the same schema as the given MODIS dataset.
To do so, you’ll use the Tilebox Console, navigate to My Datasets and click Create Dataset. Then select
Spatio-temporal Dataset as the dataset type.
For more information on creating a dataset, check out the Creating a dataset guide for a
Step by step guide.  
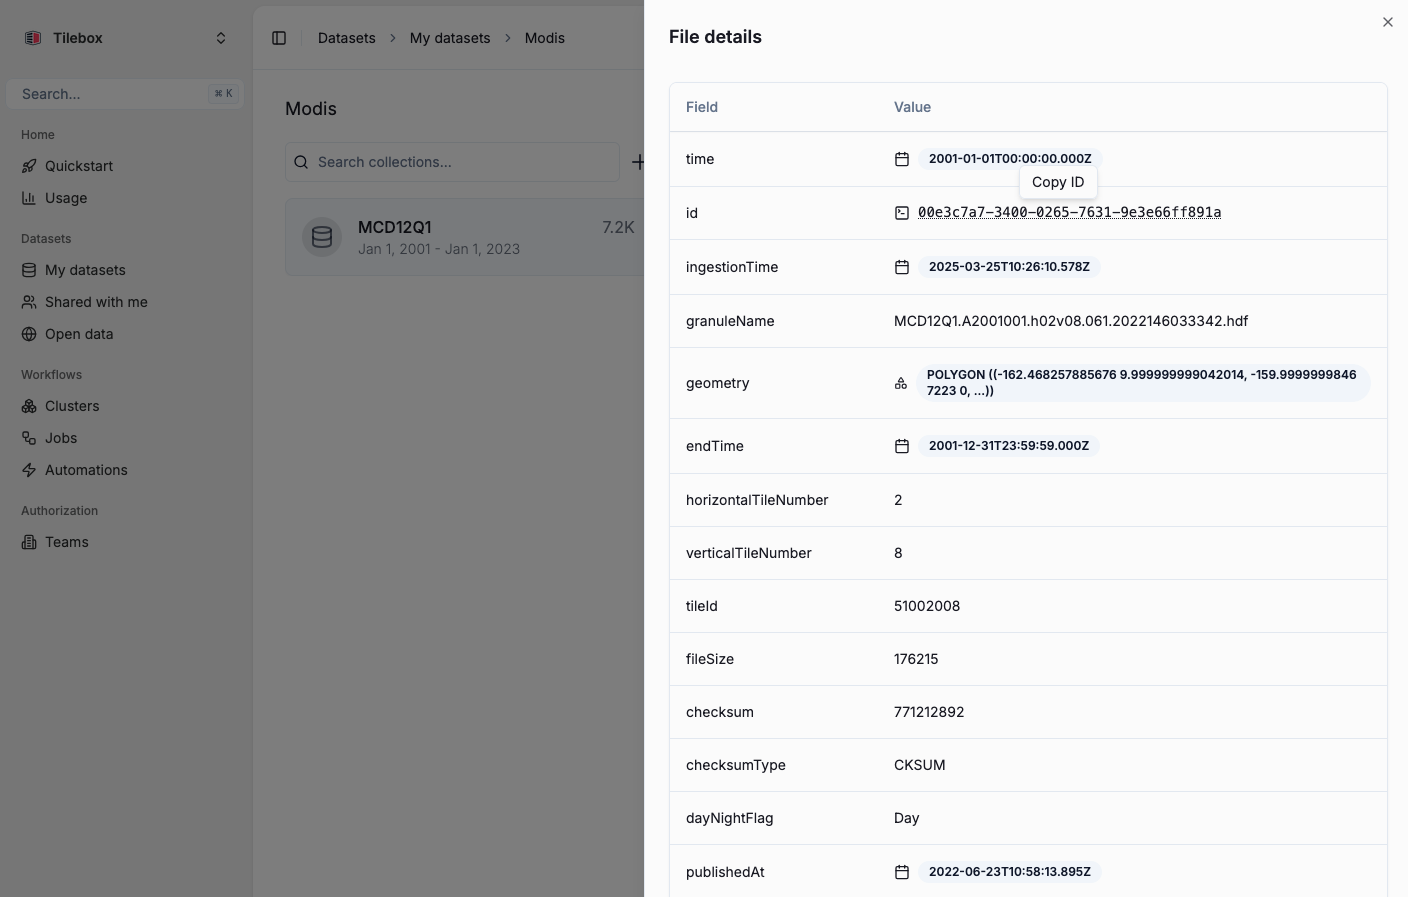
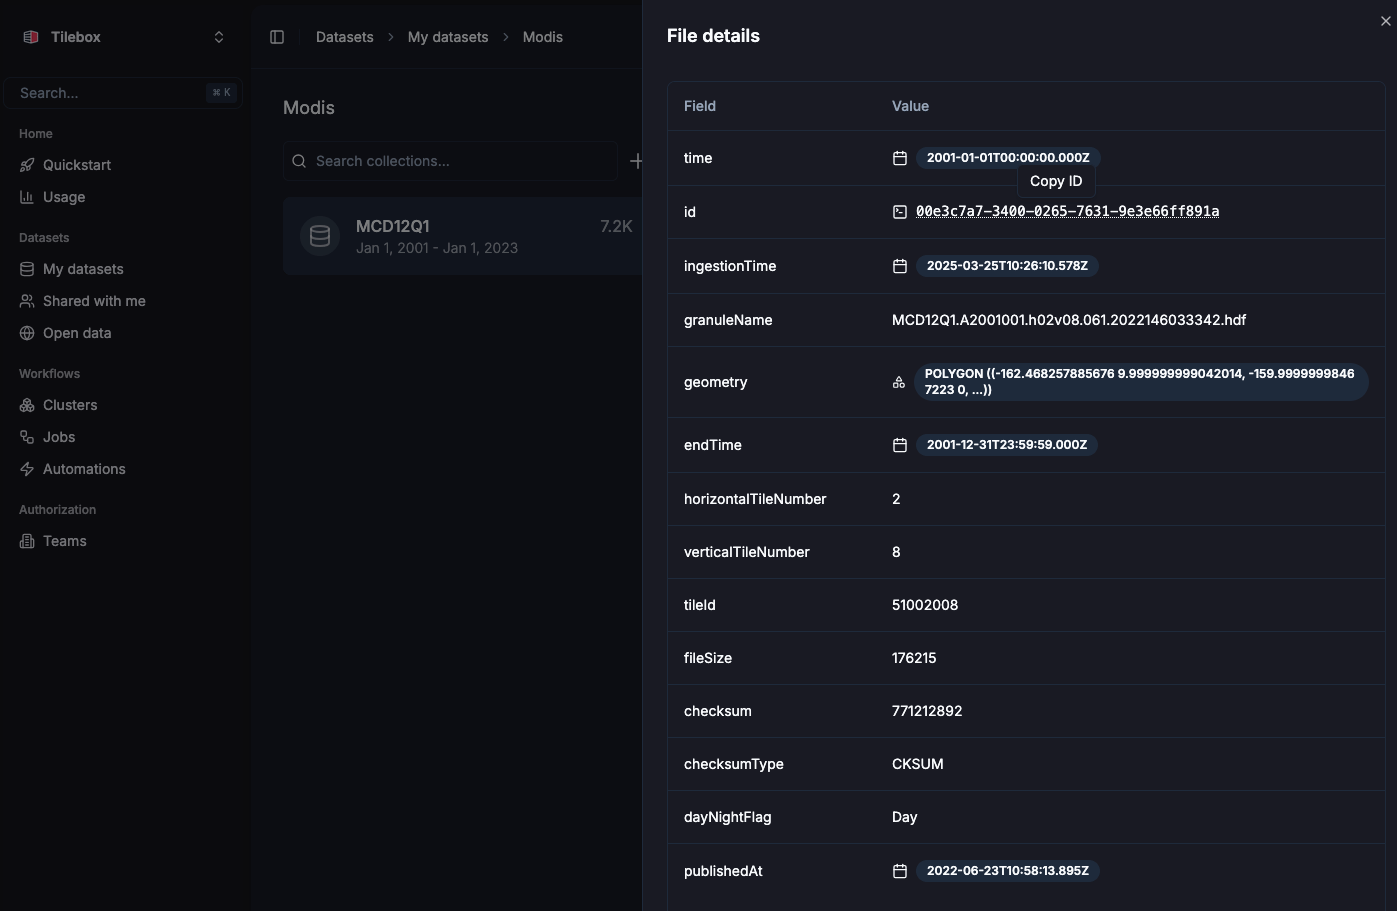
Now, to match the given MODIS dataset, you’ll specify the following fields:
| Field | Type | Note | 
|---|
granule_name | string | MODIS granule name | 
end_time | Timestamp | Measurement end time | 
horizontal_tile_number | int64 | Horizontal modis tile number (0-35) | 
vertical_tile_number | int64 | Vertical modis tile number (0-17) | 
tile_id | int64 | Modis Tile ID | 
file_size | uint64 | File size of the product in bytes | 
checksum | string | Hash checksum of the file | 
checksum_type | string | Checksum algorithm (MD5 / CKSUM) | 
day_night_flag | int64 | Day / Night / Both | 
browse_granule_id | string | Optional granule ID for browsing | 
published_at | Timestamp | The time the product was published | 
 
In the console, this will look like the following:
Access the dataset from Python
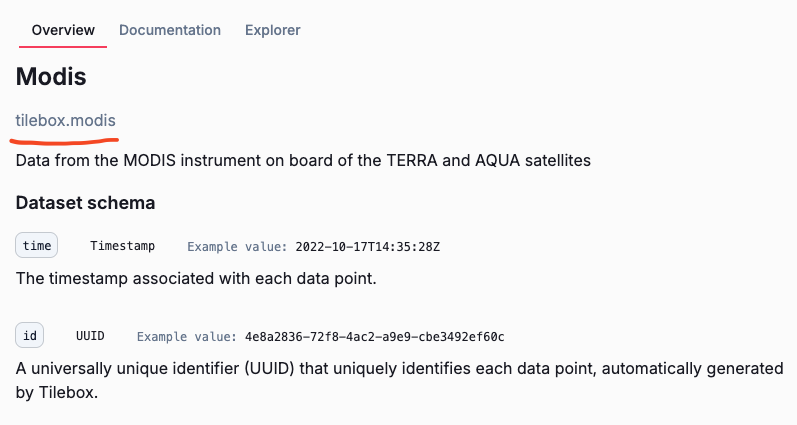
Your newly created dataset is now available. You can access it from Python. For this, you’ll need to know the dataset slug,
which was assigned automatically based on the specified code_name. To find out the slug, navigate to the dataset overview
in the console.
You can now instantiate the dataset client and access the dataset.
from tilebox.datasets import Client
client = Client()
dataset = client.dataset("tilebox.modis")  # replace with your dataset slug
 
Create a collection
Next, you’ll create a collection to insert your data into.
collection = dataset.get_or_create_collection("MCD12Q1")
 
Ingest the data
Now, you’ll finally ingest the MODIS data into the collection.
datapoint_ids = collection.ingest(modis_data)
print(f"Successfully ingested {len(datapoint_ids)} datapoints!")
 
Successfully ingested 7245 datapoints!
 
Query the newly ingested data
You can now query the newly ingested data. You can query a subset of the data for a specific time range.
Since the data is now stored directly in the Tilebox dataset, you can query and access it from anywhere.
 
from shapely import Polygon
area = Polygon(  # area roughly covering the US
    ((-124.45, 49.19), (-120.88, 29.31), (-66.87, 24.77), (-65.34, 47.84), (-124.45, 49.19)),
)
data = collection.query(
    temporal_extent=("2015-01-01", "2020-01-01"),
    spatial_extent=area
)
data
 
<xarray.Dataset> Size: 28kB
Dimensions:                 (time: 110)
Coordinates:
  * time                    (time) datetime64[ns] 880B 2015-01-01 ... 2019-01-01
Data variables: (12/14)
    id                      (time) <U36 16kB '014aa2ca-b000-100a-dd34-fae14c5...
    ingestion_time          (time) datetime64[ns] 880B 2025-07-09T09:21:34.70...
    geometry                (time) object 880B POLYGON ((-160 60, -124.457906...
    granule_name            (time) object 880B 'MCD12Q1.A2015001.h10v03.061.2...
    end_time                (time) datetime64[ns] 880B 2015-12-31T23:59:59 .....
    horizontal_tile_number  (time) int64 880B 10 13 12 11 11 10 ... 8 8 10 7 15
    ...                      ...
    file_size               (time) uint64 880B 11719196 10878403 ... 263319
    checksum                (time) object 880B '2878522088' ... '190901039'
    checksum_type           (time) object 880B 'CKSUM' 'CKSUM' ... 'CKSUM'
    day_night_flag          (time) object 880B 'Day' 'Day' 'Day' ... 'Day' 'Day'
    browse_granule_id       (time) object 880B 'UR:10:DsShESDTUR:UR:15:DsShSc...
    published_at            (time) datetime64[ns] 880B 2022-06-15T01:26:58.61...
 
For more information on accessing and querying data, check out querying data.  
View the data in the console
You can also view your data in the Console, by navigate to the dataset, selecting the collection and then clicking
on one of the data points.
Next steps
Congrats. You’ve successfully ingested data into Tilebox. You can now explore the data in the console and use it for
further processing and analysis.