Documentation Index
Fetch the complete documentation index at: https://docs.tilebox.com/llms.txt
Use this file to discover all available pages before exploring further.
Overview
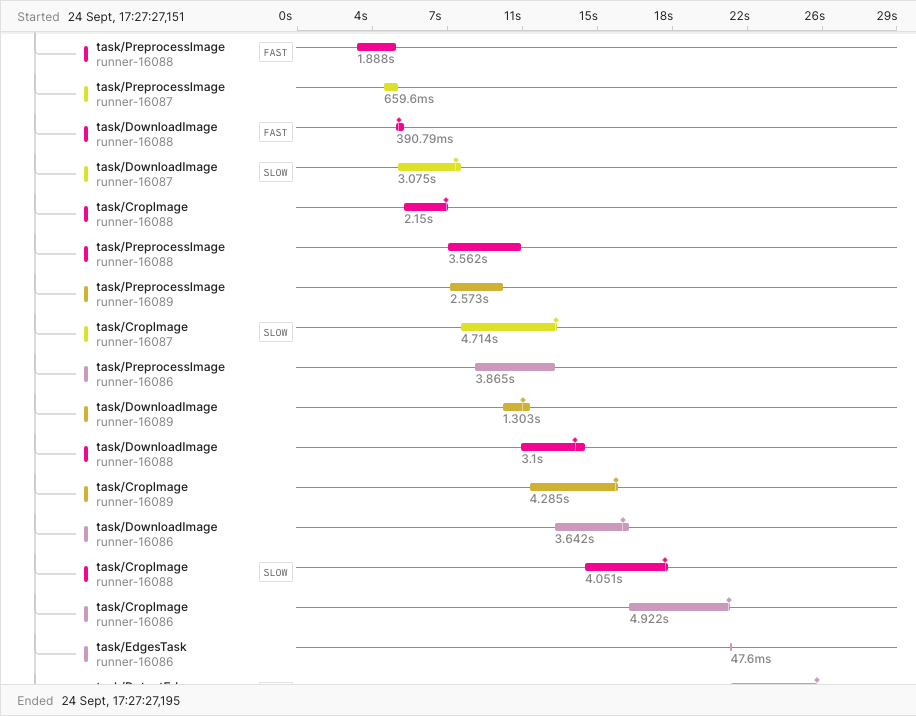
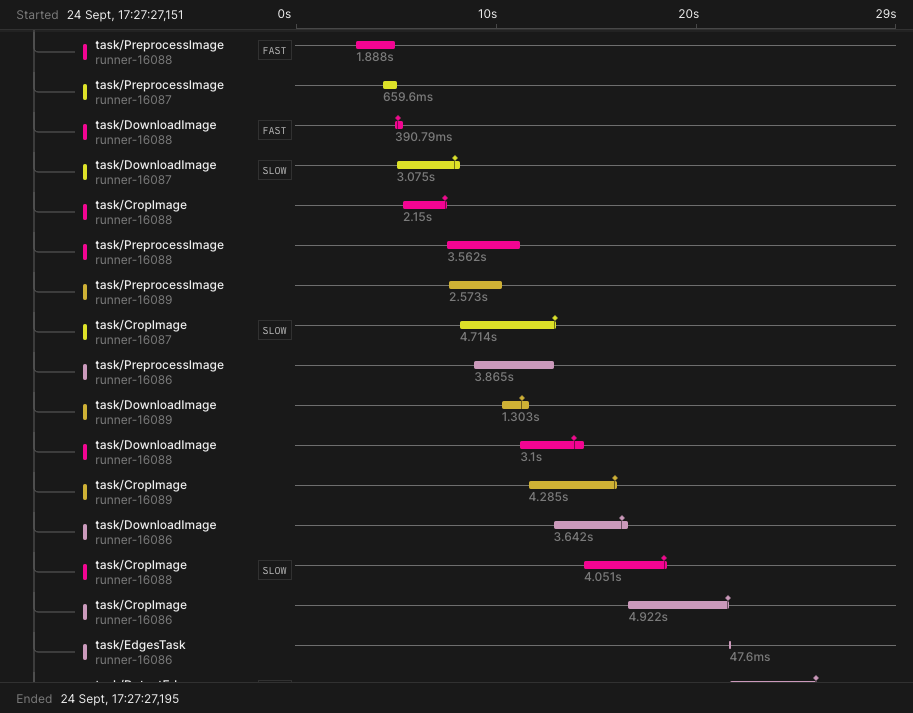
Applying OpenTelemetry traces to the concept of workflows allows you to monitor the execution of your jobs and their individual tasks. Visualizing the trace for a job in a tool like Axiom may look like this:
Tracing your workflows enables you to easily observe:
- The order of task execution
- Which tasks run in parallel
- The task runner handling each task
- The duration of each task
- The outcome of each task (success or failure)
This information helps identify bottlenecks and performance issues, ensuring that your workflows execute correctly.
The Tilebox workflow SDKs have built-in support for exporting OpenTelemetry traces. To enable tracing, call the appropriate configuration functions during the startup of your task runner.
To configure tracing with Axiom, you first need to create a Axiom Dataset to export your workflow traces to. You will also need an Axiom API key with the necessary write permissions for your Axiom dataset.from tilebox.workflows import Client
from tilebox.workflows.observability.tracing import configure_otel_tracing_axiom
# your own workflow:
from my_workflow import MyTask
def main():
configure_otel_tracing_axiom(
# specify an Axiom dataset to export traces to
dataset="my-axiom-traces-dataset",
# along with an Axiom API key for ingest permissions
api_key="my-axiom-api-key",
)
# the following task runner generates traces for executed tasks and
# exports trace and span data to the specified Axiom dataset
client = Client()
runner = client.runner(tasks=[MyTask])
runner.run_forever()
if __name__ == "__main__":
main()
Set the environment variables AXIOM_API_KEY and AXIOM_TRACES_DATASET to omit those arguments
in the configure_otel_tracing_axiom function.
If you are using another OpenTelemetry-compatible backend besides Axiom, like OpenTelemetry Collector or Jaeger, you can configure tracing by specifying the URL endpoint to export traces to.from tilebox.workflows import Client
from tilebox.workflows.observability.tracing import configure_otel_tracing
# your own workflow:
from my_workflow import MyTask
def main():
configure_otel_tracing(
# specify an endpoint for trace ingestion, such as a
# locally running instance of OpenTelemetry Collector
endpoint="http://localhost:4318/v1/traces",
# optional headers for each request
headers={"Authorization": "Bearer some-api-key"},
)
# the following task runner generates traces for executed tasks and
# exports trace and span data to the specified endpoint
client = Client()
runner = client.runner(tasks=[MyTask])
runner.run_forever()
if __name__ == "__main__":
main()
Set the environment variable OTEL_TRACES_ENDPOINT to omit that argument
in the configure_otel_tracing function.

