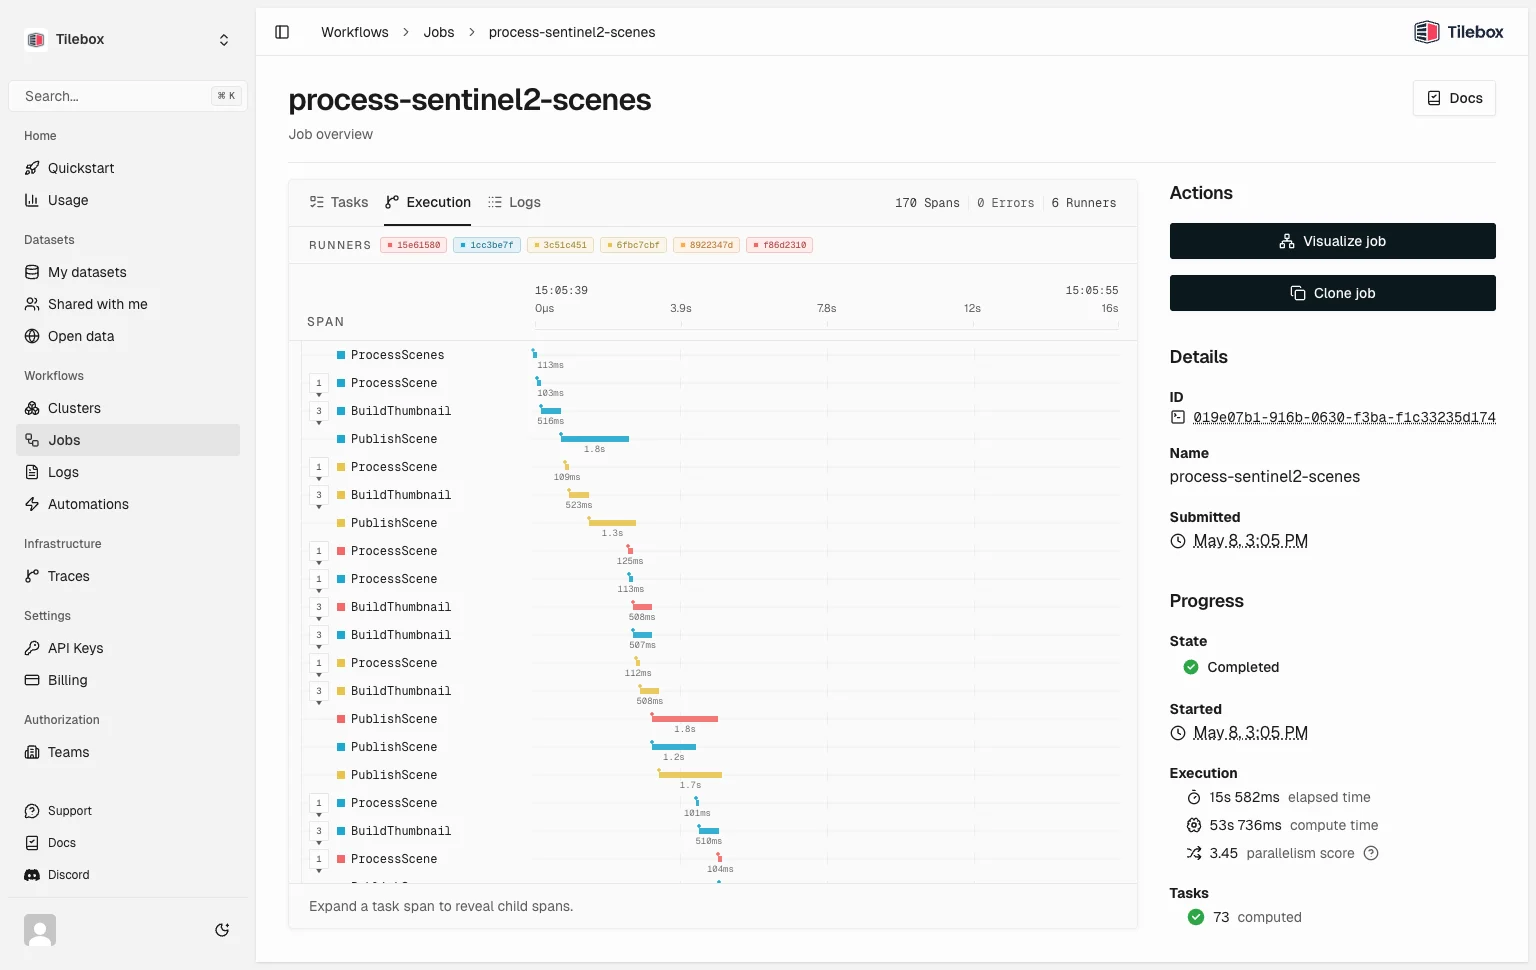
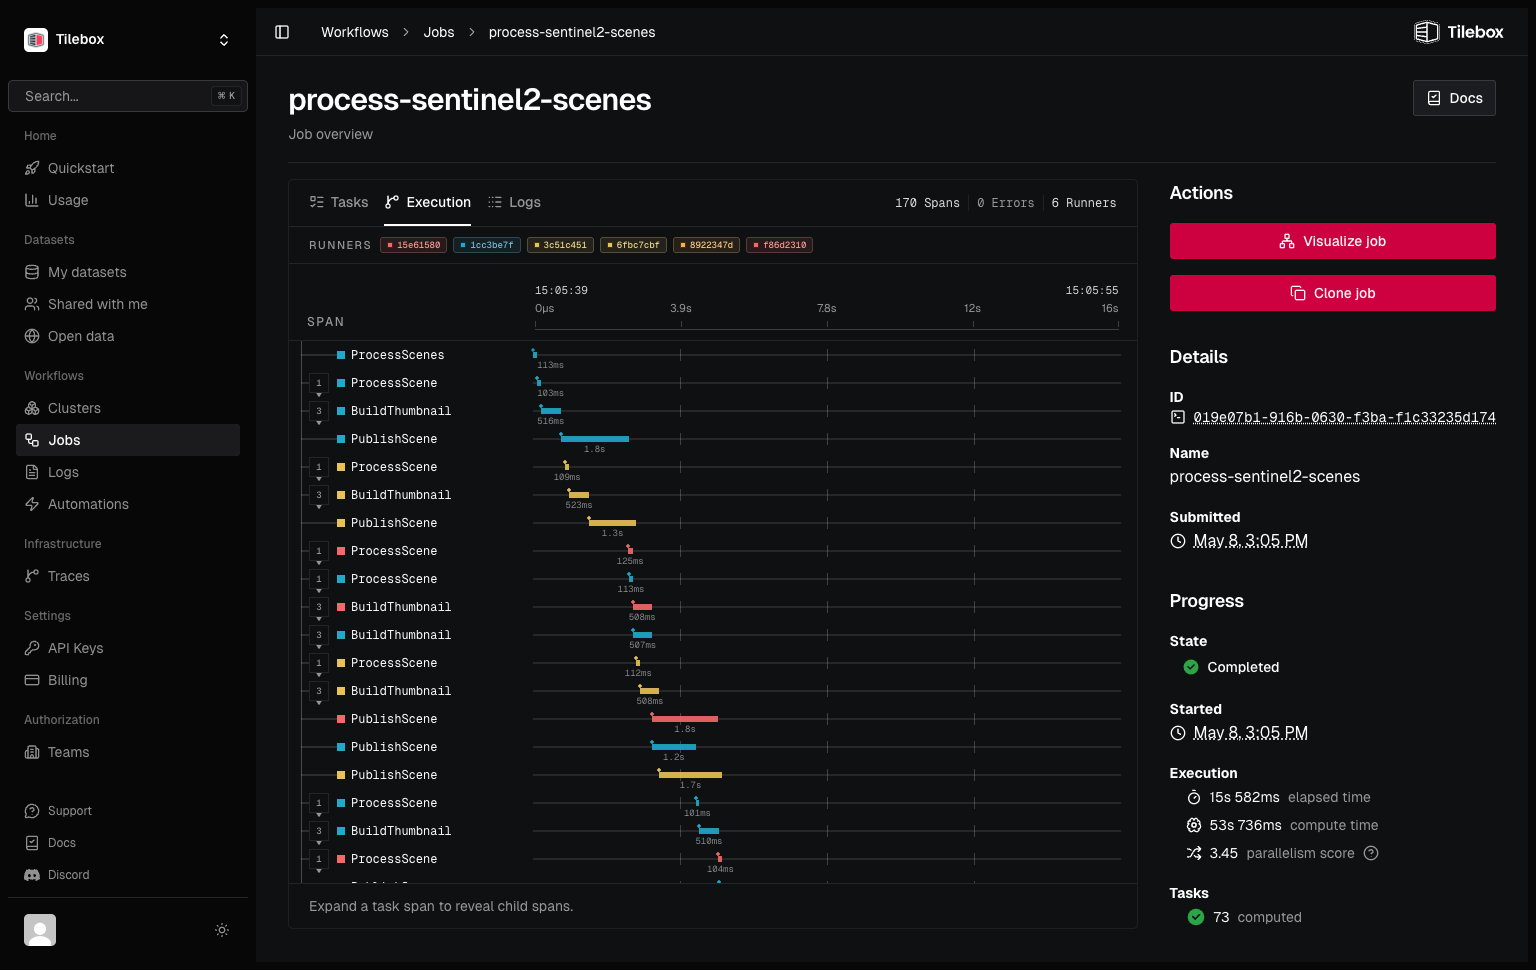
Tilebox traces workflow jobs automatically. Job submission creates a root trace, runners continue that trace across machines, and every task execution creates a span.
Job Execution Trace View
Built-in traces connect task order, dependencies, parallel execution, task duration, task status, runner identity, service identity, and logs emitted while a span was active.

Add custom spans

Use context.tracer inside a task to add spans around meaningful parts of your own code.
Custom spans are nested under the current task span. Logs emitted inside the span are correlated with its trace_id and span_id.

Span status and exceptions

If a task raises an exception, Tilebox records the exception on the task span and marks the span as failed before the task is retried or marked failed. For finer-grained error reporting, record errors on your custom spans before re-raising them.

Query spans

You can retrieve spans for a job through the jobs client. Python results can also be converted to a pandas DataFrame.
See Query telemetry for the log and span query APIs.

Export to another backend

Tilebox stores traces by default. To export spans to your own observability backend as well, configure an OpenTelemetry or Axiom integration when the runner process starts.